
New York Knicks
All teams · Eastern Conference
Roster outlook (lineup model, healthy players): offense 115.9, defense 108.6 points per 100 possessions vs last season 117.4 / 111.0.
Players
| Player | Salary | GP | GS | MIN | PTS | REB | AST | STL | BLK | TOV | FGA | FG% | 3PA | 3P% | FTA | FT% | TS% | +/- |
|---|---|---|---|---|---|---|---|---|---|---|---|---|---|---|---|---|---|---|
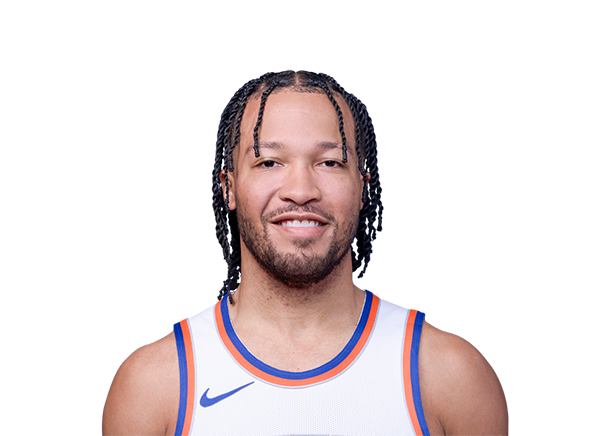 Jalen BrunsonG · 30 | $37.7M | 13 | 13 | 34.2 | 26.7 | 2.8 | 5.9 | 0.8 | 0.3 | 1.8 | 20.9 | 43.4 | 7.2 | 38.3 | 7.2 | 79.8 | 55.4 | +3.7 |
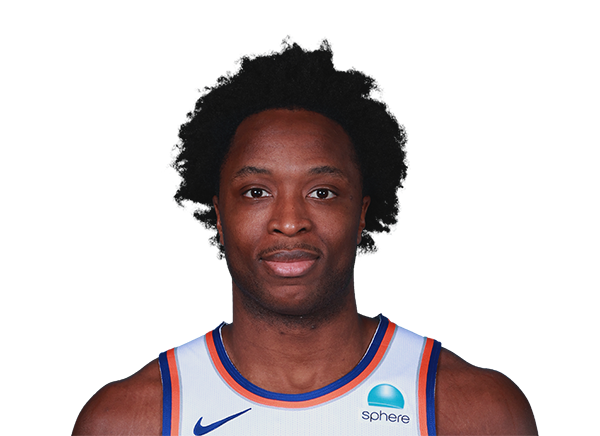 OG AnunobyF · 29 | $42.5M | 13 | 13 | 33.7 | 16.4 | 5.4 | 2.2 | 1.1 | 0.7 | 2.2 | 11.8 | 39.0 | 6.6 | 32.6 | 5.7 | 87.8 | 57.1 | +3.2 |
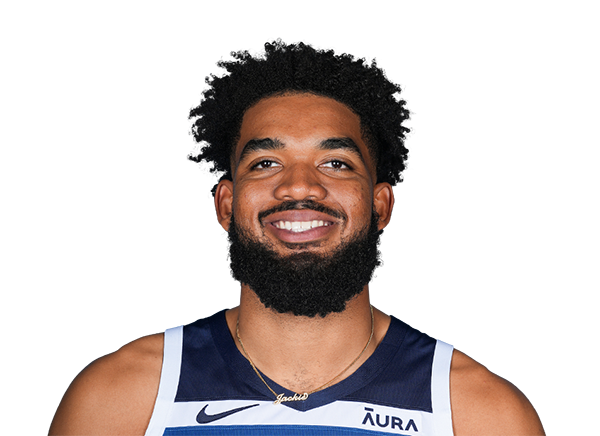 Karl-Anthony TownsC · 31 | $57.1M | 13 | 13 | 32.5 | 21.6 | 13.9 | 3.6 | 0.9 | 0.5 | 3.1 | 14.5 | 53.4 | 5.2 | 39.7 | 5.2 | 76.5 | 64.2 | +6.4 |
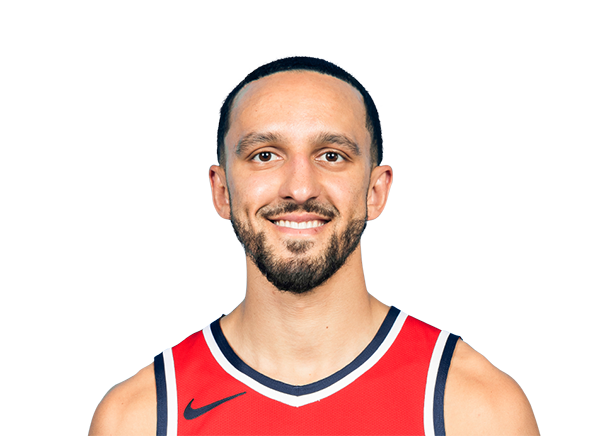 Landry ShametG · 29 | $5.4M | 13 | 3 | 25.8 | 10.3 | 1.8 | 1.8 | 0.4 | 0.2 | 1.1 | 7.4 | 47.9 | 5.3 | 42.0 | 1.3 | 76.5 | 64.7 | +7.9 |
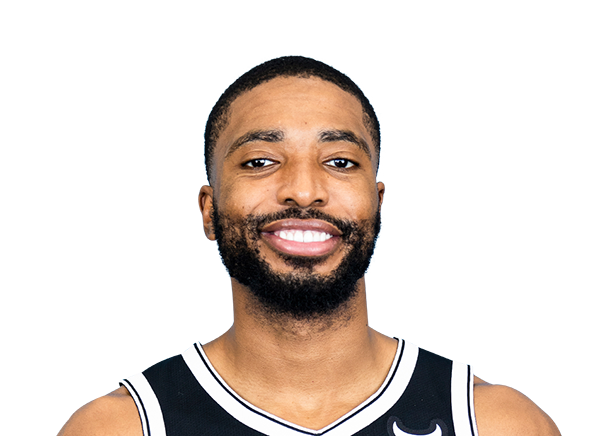 Mikal BridgesG · 30 | $33.5M | 13 | 13 | 25.3 | 6.8 | 3.5 | 2.2 | 1.1 | 0.5 | 1.2 | 7.4 | 37.5 | 3.1 | 27.5 | 0.5 | 83.3 | 44.6 | -1.7 |
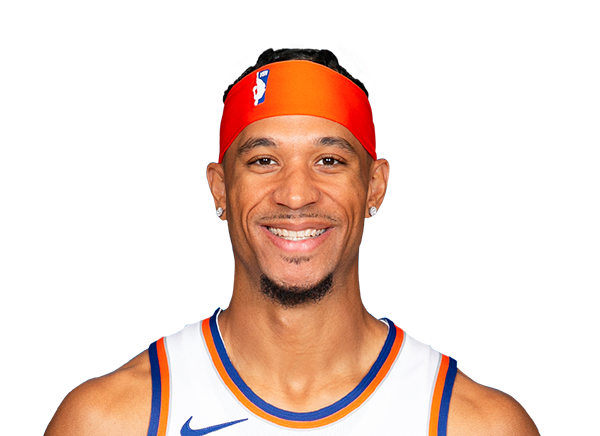 Josh HartG · 31 | $20.9M | 10 | 10 | 29.7 | 6.6 | 6.5 | 3.6 | 1.7 | 0.2 | 1.4 | 7.4 | 33.8 | 4.5 | 28.9 | 0.5 | 60.0 | 43.3 | +0.8 |
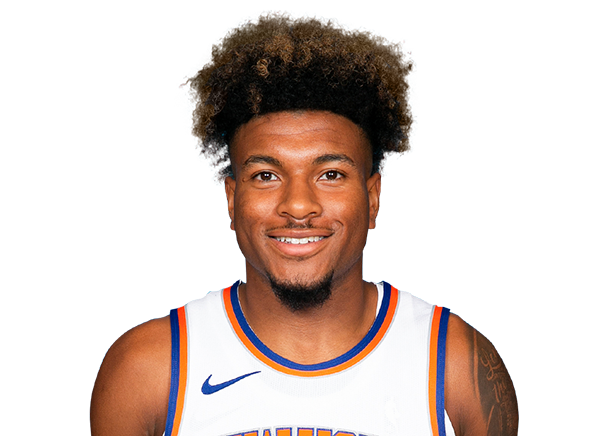 Miles McBrideG · 26 | $4.0M | 13 | 0 | 18.8 | 7.6 | 1.5 | 1.1 | 0.8 | 0.3 | 0.3 | 6.0 | 43.6 | 4.8 | 43.5 | 0.4 | 80.0 | 61.7 | +2.2 |
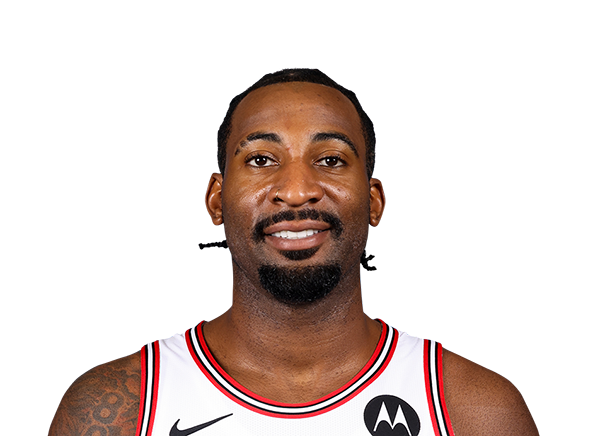 Andre DrummondC · 33 | $2.4M | 13 | 0 | 13.0 | 3.8 | 7.5 | 1.2 | 0.3 | 0.6 | 0.7 | 3.8 | 42.0 | 0.1 | 0.0 | 0.9 | 58.3 | 44.3 | +1.4 |
 Tyler KolekG · 25 | $2.3M | 11 | 0 | 13.6 | 3.3 | 2.0 | 4.8 | 0.5 | 0.1 | 0.5 | 3.2 | 40.0 | 1.8 | 30.0 | 0.2 | 100.0 | 50.2 | +4.9 |
 Jordan ClarksonG · 34 | $2.4M | 11 | 0 | 10.0 | 5.1 | 1.7 | 0.5 | 0.2 | 0.2 | 0.3 | 4.3 | 51.1 | 1.0 | 54.5 | 0.3 | 66.7 | 57.9 | +3.7 |
 Mohamed DiawaraF · 21 | $2.2M | 6 | 0 | 11.8 | 2.8 | 2.2 | 1.7 | 0.0 | 0.3 | 0.5 | 3.2 | 31.6 | 2.3 | 14.3 | 0.7 | 75.0 | 40.9 | +2.5 |
 Jose AlvaradoG · 28 | $4.5M | 6 | 0 | 8.8 | 1.7 | 1.0 | 1.5 | 0.5 | 0.2 | 1.2 | 2.8 | 23.5 | 1.5 | 22.2 | 0.0 | – | 29.4 | -1.3 |
 Dalton KnechtF · 25 | $4.2M | 3 | 0 | 9.7 | 4.3 | 2.3 | 0.3 | 0.0 | 0.3 | 0.0 | 2.7 | 62.5 | 2.0 | 50.0 | 0.0 | – | 81.2 | -5.3 |
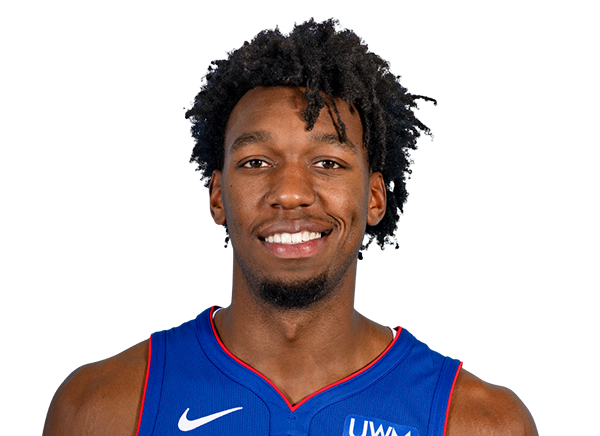 James WisemanC · 25 | $2.4M | 6 | 0 | 4.7 | 1.3 | 2.5 | 0.0 | 0.2 | 0.7 | 0.5 | 1.7 | 40.0 | 0.0 | – | 0.0 | – | 40.0 | +0.0 |
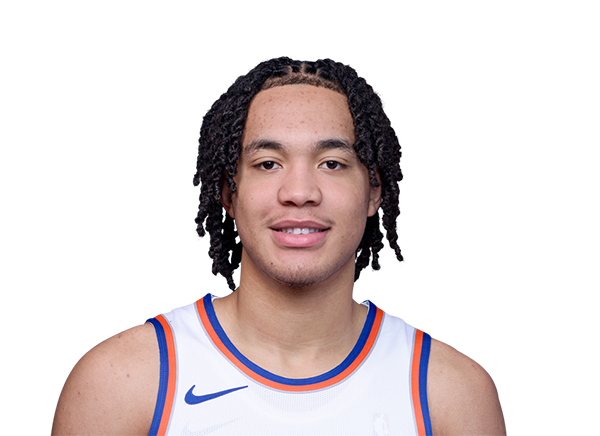 Pacome DadietF · 21 | $3.0M | 4 | 0 | 4.2 | 3.0 | 0.8 | 0.0 | 0.0 | 0.0 | 0.0 | 2.2 | 55.6 | 1.0 | 25.0 | 0.2 | 100.0 | 63.6 | -1.5 |
 Jaden AkinsG · 23 | – | 1 | 0 | 2.0 | 0.0 | 0.0 | 0.0 | 0.0 | 0.0 | 0.0 | 0.0 | – | 0.0 | – | 0.0 | – | – | -1.0 |
 Tyler NickelF · 23 | – | no games | ||||||||||||||||
| Player | Salary | GP | GS | MIN | PTS | REB | AST | STL | BLK | TOV | FGA | FG% | 3PA | 3P% | FTA | FT% | TS% | +/- |
|---|---|---|---|---|---|---|---|---|---|---|---|---|---|---|---|---|---|---|
| Jalen BrunsonG · 30 | $37.7M | 13 | 13 | 34.2 | 28.1 | 2.9 | 6.2 | 0.8 | 0.3 | 1.9 | 22.0 | 43.4 | 7.6 | 38.3 | 7.6 | 79.8 | 55.4 | +3.9 |
| OG AnunobyF · 29 | $42.5M | 13 | 13 | 33.7 | 17.5 | 5.8 | 2.3 | 1.2 | 0.7 | 2.4 | 12.7 | 39.0 | 7.1 | 32.6 | 6.1 | 87.8 | 57.1 | +3.4 |
| Karl-Anthony TownsC · 31 | $57.1M | 13 | 13 | 32.5 | 24.0 | 15.4 | 4.0 | 1.0 | 0.5 | 3.4 | 16.1 | 53.4 | 5.8 | 39.7 | 5.8 | 76.5 | 64.2 | +7.1 |
| Landry ShametG · 29 | $5.4M | 13 | 3 | 25.8 | 14.4 | 2.5 | 2.6 | 0.5 | 0.3 | 1.5 | 10.3 | 47.9 | 7.4 | 42.0 | 1.8 | 76.5 | 64.7 | +11.0 |
| Mikal BridgesG · 30 | $33.5M | 13 | 13 | 25.3 | 9.6 | 4.9 | 3.2 | 1.5 | 0.8 | 1.6 | 10.5 | 37.5 | 4.4 | 27.5 | 0.7 | 83.3 | 44.6 | -2.4 |
| Josh HartG · 31 | $20.9M | 10 | 10 | 29.7 | 8.0 | 7.9 | 4.4 | 2.1 | 0.2 | 1.7 | 9.0 | 33.8 | 5.5 | 28.9 | 0.6 | 60.0 | 43.3 | +1.0 |
| Miles McBrideG · 26 | $4.0M | 13 | 0 | 18.8 | 14.6 | 2.8 | 2.1 | 1.5 | 0.6 | 0.6 | 11.5 | 43.6 | 9.1 | 43.5 | 0.7 | 80.0 | 61.7 | +4.3 |
| Andre DrummondC · 33 | $2.4M | 13 | 0 | 13.0 | 10.4 | 20.7 | 3.2 | 0.9 | 1.7 | 1.9 | 10.7 | 42.0 | 0.2 | 0.0 | 2.6 | 58.3 | 44.3 | +3.8 |
| Tyler KolekG · 25 | $2.3M | 11 | 0 | 13.6 | 8.6 | 5.3 | 12.7 | 1.4 | 0.2 | 1.4 | 8.4 | 40.0 | 4.8 | 30.0 | 0.5 | 100.0 | 50.2 | +13.0 |
| Jordan ClarksonG · 34 | $2.4M | 11 | 0 | 10.0 | 18.3 | 6.2 | 1.6 | 0.7 | 0.7 | 1.0 | 15.4 | 51.1 | 3.6 | 54.5 | 1.0 | 66.7 | 57.9 | +13.4 |
| Mohamed DiawaraF · 21 | $2.2M | 6 | 0 | 11.8 | 8.6 | 6.6 | 5.1 | 0.0 | 1.0 | 1.5 | 9.6 | 31.6 | 7.1 | 14.3 | 2.0 | 75.0 | 40.9 | +7.6 |
| Jose AlvaradoG · 28 | $4.5M | 6 | 0 | 8.8 | 6.8 | 4.1 | 6.1 | 2.0 | 0.7 | 4.8 | 11.5 | 23.5 | 6.1 | 22.2 | 0.0 | – | 29.4 | -5.4 |
| Dalton KnechtF · 25 | $4.2M | 3 | 0 | 9.7 | 16.1 | 8.7 | 1.2 | 0.0 | 1.2 | 0.0 | 9.9 | 62.5 | 7.4 | 50.0 | 0.0 | – | 81.2 | -19.9 |
| James WisemanC · 25 | $2.4M | 6 | 0 | 4.7 | 10.3 | 19.3 | 0.0 | 1.3 | 5.1 | 3.9 | 12.9 | 40.0 | 0.0 | – | 0.0 | – | 40.0 | +0.0 |
| Pacome DadietF · 21 | $3.0M | 4 | 0 | 4.2 | 25.4 | 6.4 | 0.0 | 0.0 | 0.0 | 0.0 | 19.1 | 55.6 | 8.5 | 25.0 | 2.1 | 100.0 | 63.6 | -12.7 |
| Jaden AkinsG · 23 | – | 1 | 0 | 2.0 | 0.0 | 0.0 | 0.0 | 0.0 | 0.0 | 0.0 | 0.0 | – | 0.0 | – | 0.0 | – | – | -18.0 |
| Tyler NickelF · 23 | – | no games | ||||||||||||||||
| Player | Salary | GP | GS | MIN | PTS | REB | AST | STL | BLK | TOV | FGA | FG% | 3PA | 3P% | FTA | FT% | TS% | +/- |
|---|---|---|---|---|---|---|---|---|---|---|---|---|---|---|---|---|---|---|
| Jalen BrunsonG · 30 | $37.7M | 13 | 13 | 445 | 347 | 36 | 77 | 10 | 4 | 24 | 272 | 43.4 | 94 | 38.3 | 94 | 79.8 | 55.4 | +48.0 |
| OG AnunobyF · 29 | $42.5M | 13 | 13 | 438 | 213 | 70 | 28 | 14 | 9 | 29 | 154 | 39.0 | 86 | 32.6 | 74 | 87.8 | 57.1 | +41.0 |
| Karl-Anthony TownsC · 31 | $57.1M | 13 | 13 | 422 | 281 | 181 | 47 | 12 | 6 | 40 | 189 | 53.4 | 68 | 39.7 | 68 | 76.5 | 64.2 | +83.0 |
| Landry ShametG · 29 | $5.4M | 13 | 3 | 336 | 134 | 23 | 24 | 5 | 3 | 14 | 96 | 47.9 | 69 | 42.0 | 17 | 76.5 | 64.7 | +103.0 |
| Mikal BridgesG · 30 | $33.5M | 13 | 13 | 329 | 88 | 45 | 29 | 14 | 7 | 15 | 96 | 37.5 | 40 | 27.5 | 6 | 83.3 | 44.6 | -22.0 |
| Josh HartG · 31 | $20.9M | 10 | 10 | 297 | 66 | 65 | 36 | 17 | 2 | 14 | 74 | 33.8 | 45 | 28.9 | 5 | 60.0 | 43.3 | +8.0 |
| Miles McBrideG · 26 | $4.0M | 13 | 0 | 244 | 99 | 19 | 14 | 10 | 4 | 4 | 78 | 43.6 | 62 | 43.5 | 5 | 80.0 | 61.7 | +29.0 |
| Andre DrummondC · 33 | $2.4M | 13 | 0 | 169 | 49 | 97 | 15 | 4 | 8 | 9 | 50 | 42.0 | 1 | 0.0 | 12 | 58.3 | 44.3 | +18.0 |
| Tyler KolekG · 25 | $2.3M | 11 | 0 | 150 | 36 | 22 | 53 | 6 | 1 | 6 | 35 | 40.0 | 20 | 30.0 | 2 | 100.0 | 50.2 | +54.0 |
| Jordan ClarksonG · 34 | $2.4M | 11 | 0 | 110 | 56 | 19 | 5 | 2 | 2 | 3 | 47 | 51.1 | 11 | 54.5 | 3 | 66.7 | 57.9 | +41.0 |
| Mohamed DiawaraF · 21 | $2.2M | 6 | 0 | 71 | 17 | 13 | 10 | 0 | 2 | 3 | 19 | 31.6 | 14 | 14.3 | 4 | 75.0 | 40.9 | +15.0 |
| Jose AlvaradoG · 28 | $4.5M | 6 | 0 | 53 | 10 | 6 | 9 | 3 | 1 | 7 | 17 | 23.5 | 9 | 22.2 | 0 | – | 29.4 | -8.0 |
| Dalton KnechtF · 25 | $4.2M | 3 | 0 | 29 | 13 | 7 | 1 | 0 | 1 | 0 | 8 | 62.5 | 6 | 50.0 | 0 | – | 81.2 | -16.0 |
| James WisemanC · 25 | $2.4M | 6 | 0 | 28 | 8 | 15 | 0 | 1 | 4 | 3 | 10 | 40.0 | 0 | – | 0 | – | 40.0 | +0.0 |
| Pacome DadietF · 21 | $3.0M | 4 | 0 | 17 | 12 | 3 | 0 | 0 | 0 | 0 | 9 | 55.6 | 4 | 25.0 | 1 | 100.0 | 63.6 | -6.0 |
| Jaden AkinsG · 23 | – | 1 | 0 | 2 | 0 | 0 | 0 | 0 | 0 | 0 | 0 | – | 0 | – | 0 | – | – | -1.0 |
| Tyler NickelF · 23 | – | no games | ||||||||||||||||
| Player | Salary | GP | GS | MIN | PTS | REB | AST | STL | BLK | TOV | FGA | FG% | 3PA | 3P% | FTA | FT% | TS% | +/- |
|---|---|---|---|---|---|---|---|---|---|---|---|---|---|---|---|---|---|---|
| Mikal BridgesG · 30 | $24.9M | 82 | 82 | 33.3 | 14.5 | 3.9 | 3.8 | 1.3 | 0.8 | 1.0 | 11.9 | 48.8 | 5.2 | 36.9 | 1.2 | 83.0 | 58.5 | +3.5 |
| Jalen BrunsonG · 30 · with NY/? | $34.9M | 78 | 78 | 34.2 | 25.2 | 3.3 | 6.6 | 0.8 | 0.1 | 2.3 | 19.4 | 46.7 | 6.9 | 37.1 | 5.4 | 83.8 | 57.9 | +4.3 |
| Karl-Anthony TownsC · 31 · with NY/? | $54.1M | 78 | 77 | 30.4 | 19.7 | 11.6 | 2.9 | 0.9 | 0.5 | 2.4 | 13.5 | 50.3 | 4.1 | 37.5 | 5.4 | 86.0 | 62.2 | +4.8 |
| OG AnunobyF · 29 | $39.6M | 68 | 68 | 33.3 | 16.9 | 5.3 | 2.2 | 1.5 | 0.7 | 1.8 | 12.1 | 48.6 | 6.1 | 38.8 | 3.3 | 82.3 | 62.3 | +6.1 |
| Josh HartG · 31 | $19.5M | 67 | 53 | 30.2 | 12.0 | 7.4 | 4.8 | 1.1 | 0.3 | 1.9 | 8.9 | 51.1 | 3.7 | 41.2 | 1.9 | 72.0 | 61.4 | +3.2 |
| Jose AlvaradoG · 28 · with NO/NY | $4.5M | 69 | 3 | 19.9 | 7.4 | 2.5 | 3.4 | 1.0 | 0.1 | 1.1 | 6.5 | 41.6 | 4.2 | 35.2 | 0.7 | 76.1 | 54.3 | +0.3 |
| Jordan ClarksonG · 34 | $2.3M | 73 | 1 | 17.9 | 8.7 | 1.8 | 1.3 | 0.4 | 0.1 | 0.9 | 7.4 | 44.9 | 3.0 | 33.0 | 1.3 | 83.0 | 54.7 | +1.7 |
| Andre DrummondC · 33 · with PHI | $5.0M | 63 | 25 | 19.6 | 6.4 | 8.4 | 1.3 | 0.6 | 0.8 | 1.0 | 5.3 | 47.2 | 1.4 | 35.6 | 1.3 | 63.1 | 53.9 | -1.4 |
| Landry ShametG · 29 | $2.3M | 51 | 12 | 23.0 | 9.3 | 1.8 | 1.4 | 0.6 | 0.2 | 0.6 | 7.1 | 43.7 | 5.2 | 39.2 | 1.5 | 71.1 | 59.8 | +3.7 |
| Miles McBrideG · 26 | $4.3M | 41 | 15 | 26.3 | 12.0 | 2.4 | 2.6 | 0.9 | 0.2 | 0.8 | 9.9 | 42.3 | 6.6 | 41.3 | 1.1 | 78.7 | 57.8 | +5.5 |
| Tyler KolekG · 25 | $2.2M | 61 | 1 | 12.3 | 4.7 | 1.7 | 2.9 | 0.4 | 0.1 | 0.9 | 4.2 | 44.0 | 2.0 | 38.7 | 0.4 | 72.7 | 54.0 | +1.9 |
| Mohamed DiawaraF · 21 | $1.3M | 68 | 7 | 9.3 | 3.6 | 1.4 | 0.8 | 0.2 | 0.1 | 0.4 | 3.1 | 42.3 | 1.9 | 36.9 | 0.4 | 75.0 | 55.0 | +0.9 |
| Dalton KnechtF · 25 · with LAL | $4.0M | 54 | 1 | 10.2 | 4.2 | 1.4 | 0.4 | 0.2 | 0.2 | 0.4 | 3.5 | 45.5 | 2.1 | 34.2 | 0.4 | 72.7 | 56.8 | -1.5 |
| Pacome DadietF · 21 | $2.8M | 28 | 0 | 4.9 | 1.7 | 1.0 | 0.4 | 0.1 | 0.0 | 0.1 | 1.7 | 33.3 | 1.1 | 21.9 | 0.4 | 81.8 | 45.4 | -0.2 |
| James WisemanC · 25 · with IND | $2.7M | 4 | 1 | 14.8 | 3.2 | 2.0 | 0.8 | 0.0 | 0.2 | 1.2 | 2.5 | 60.0 | 0.0 | – | 0.5 | 50.0 | 59.7 | -2.2 |
| Jaden AkinsG · 23 | – | no games | ||||||||||||||||
| Tyler NickelF · 23 | – | no games | ||||||||||||||||
| Player | Salary | GP | GS | MIN | PTS | REB | AST | STL | BLK | TOV | FGA | FG% | 3PA | 3P% | FTA | FT% | TS% | +/- |
|---|---|---|---|---|---|---|---|---|---|---|---|---|---|---|---|---|---|---|
| Mikal BridgesG · 30 | $24.9M | 82 | 82 | 33.3 | 15.7 | 4.2 | 4.1 | 1.4 | 0.8 | 1.1 | 12.9 | 48.8 | 5.6 | 36.9 | 1.3 | 83.0 | 58.5 | +3.8 |
| Jalen BrunsonG · 30 · with NY/? | $34.9M | 78 | 78 | 34.2 | 26.6 | 3.4 | 7.0 | 0.8 | 0.1 | 2.4 | 20.4 | 46.7 | 7.3 | 37.1 | 5.7 | 83.8 | 57.9 | +4.6 |
| Karl-Anthony TownsC · 31 · with NY/? | $54.1M | 78 | 77 | 30.4 | 23.3 | 13.7 | 3.4 | 1.0 | 0.6 | 2.9 | 16.0 | 50.3 | 4.8 | 37.5 | 6.4 | 86.0 | 62.2 | +5.7 |
| OG AnunobyF · 29 | $39.6M | 68 | 68 | 33.3 | 18.2 | 5.7 | 2.4 | 1.7 | 0.8 | 2.0 | 13.0 | 48.6 | 6.6 | 38.8 | 3.6 | 82.3 | 62.3 | +6.6 |
| Josh HartG · 31 | $19.5M | 67 | 53 | 30.2 | 14.3 | 8.8 | 5.7 | 1.4 | 0.3 | 2.3 | 10.6 | 51.1 | 4.4 | 41.2 | 2.2 | 72.0 | 61.4 | +3.8 |
| Jose AlvaradoG · 28 · with NO/NY | $4.5M | 69 | 3 | 19.9 | 13.4 | 4.5 | 6.1 | 1.7 | 0.2 | 2.0 | 11.8 | 41.6 | 7.5 | 35.2 | 1.2 | 76.1 | 54.3 | +0.6 |
| Jordan ClarksonG · 34 | $2.3M | 73 | 1 | 17.9 | 17.5 | 3.6 | 2.6 | 0.9 | 0.3 | 1.7 | 14.9 | 44.9 | 6.1 | 33.0 | 2.6 | 83.0 | 54.7 | +3.4 |
| Andre DrummondC · 33 · with PHI | $5.0M | 63 | 25 | 19.6 | 11.7 | 15.5 | 2.3 | 1.1 | 1.4 | 1.8 | 9.8 | 47.2 | 2.6 | 35.6 | 2.4 | 63.1 | 53.9 | -2.5 |
| Landry ShametG · 29 | $2.3M | 51 | 12 | 23.0 | 14.6 | 2.8 | 2.2 | 1.0 | 0.3 | 0.9 | 11.2 | 43.7 | 8.1 | 39.2 | 2.3 | 71.1 | 59.8 | +5.9 |
| Miles McBrideG · 26 | $4.3M | 41 | 15 | 26.3 | 16.4 | 3.3 | 3.5 | 1.2 | 0.3 | 1.1 | 13.5 | 42.3 | 9.0 | 41.3 | 1.6 | 78.7 | 57.8 | +7.5 |
| Tyler KolekG · 25 | $2.2M | 61 | 1 | 12.3 | 13.8 | 5.0 | 8.4 | 1.1 | 0.2 | 2.7 | 12.4 | 44.0 | 5.7 | 38.7 | 1.1 | 72.7 | 54.0 | +5.6 |
| Mohamed DiawaraF · 21 | $1.3M | 68 | 7 | 9.3 | 13.9 | 5.3 | 3.0 | 1.0 | 0.3 | 1.7 | 12.1 | 42.3 | 7.4 | 36.9 | 1.4 | 75.0 | 55.0 | +3.3 |
| Dalton KnechtF · 25 · with LAL | $4.0M | 54 | 1 | 10.2 | 14.9 | 4.9 | 1.4 | 0.7 | 0.7 | 1.5 | 12.5 | 45.5 | 7.2 | 34.2 | 1.4 | 72.7 | 56.8 | -5.3 |
| Pacome DadietF · 21 | $2.8M | 28 | 0 | 4.9 | 12.5 | 7.0 | 3.1 | 0.8 | 0.3 | 0.8 | 12.5 | 33.3 | 8.3 | 21.9 | 2.9 | 81.8 | 45.4 | -1.3 |
| James WisemanC · 25 · with IND | $2.7M | 4 | 1 | 14.8 | 7.9 | 4.9 | 1.8 | 0.0 | 0.6 | 3.1 | 6.1 | 60.0 | 0.0 | – | 1.2 | 50.0 | 59.7 | -5.5 |
| Jaden AkinsG · 23 | – | no games | ||||||||||||||||
| Tyler NickelF · 23 | – | no games | ||||||||||||||||
| Player | Salary | GP | GS | MIN | PTS | REB | AST | STL | BLK | TOV | FGA | FG% | 3PA | 3P% | FTA | FT% | TS% | +/- |
|---|---|---|---|---|---|---|---|---|---|---|---|---|---|---|---|---|---|---|
| Mikal BridgesG · 30 | $24.9M | 82 | 82 | 2728 | 1192 | 317 | 309 | 107 | 62 | 84 | 975 | 48.8 | 425 | 36.9 | 100 | 83.0 | 58.5 | +288.0 |
| Jalen BrunsonG · 30 · with NY/? | $34.9M | 78 | 78 | 2664 | 1965 | 254 | 515 | 59 | 9 | 179 | 1511 | 46.7 | 537 | 37.1 | 425 | 83.8 | 57.9 | +339.0 |
| Karl-Anthony TownsC · 31 · with NY/? | $54.1M | 78 | 77 | 2369 | 1536 | 903 | 227 | 67 | 40 | 189 | 1050 | 50.3 | 317 | 37.5 | 420 | 86.0 | 62.2 | +374.0 |
| OG AnunobyF · 29 | $39.6M | 68 | 68 | 2266 | 1146 | 360 | 148 | 104 | 49 | 123 | 821 | 48.6 | 417 | 38.8 | 226 | 82.3 | 62.3 | +414.0 |
| Josh HartG · 31 | $19.5M | 67 | 53 | 2025 | 803 | 494 | 320 | 77 | 18 | 129 | 599 | 51.1 | 245 | 41.2 | 125 | 72.0 | 61.4 | +213.0 |
| Jose AlvaradoG · 28 · with NO/NY | $4.5M | 69 | 3 | 1371 | 510 | 171 | 234 | 66 | 8 | 77 | 449 | 41.6 | 287 | 35.2 | 46 | 76.1 | 54.3 | +24.0 |
| Jordan ClarksonG · 34 | $2.3M | 73 | 1 | 1308 | 637 | 129 | 96 | 31 | 10 | 63 | 541 | 44.9 | 221 | 33.0 | 94 | 83.0 | 54.7 | +125.0 |
| Andre DrummondC · 33 · with PHI | $5.0M | 63 | 25 | 1235 | 403 | 532 | 80 | 38 | 49 | 61 | 337 | 47.2 | 90 | 35.6 | 84 | 63.1 | 53.9 | -86.0 |
| Landry ShametG · 29 | $2.3M | 51 | 12 | 1173 | 475 | 92 | 72 | 31 | 9 | 30 | 364 | 43.7 | 263 | 39.2 | 76 | 71.1 | 59.8 | +191.0 |
| Miles McBrideG · 26 | $4.3M | 41 | 15 | 1080 | 491 | 100 | 106 | 35 | 9 | 33 | 404 | 42.3 | 271 | 41.3 | 47 | 78.7 | 57.8 | +224.0 |
| Tyler KolekG · 25 | $2.2M | 61 | 1 | 749 | 288 | 103 | 175 | 22 | 4 | 56 | 257 | 44.0 | 119 | 38.7 | 22 | 72.7 | 54.0 | +116.0 |
| Mohamed DiawaraF · 21 | $1.3M | 68 | 7 | 635 | 246 | 94 | 53 | 17 | 6 | 30 | 213 | 42.3 | 130 | 36.9 | 24 | 75.0 | 55.0 | +58.0 |
| Dalton KnechtF · 25 · with LAL | $4.0M | 54 | 1 | 552 | 228 | 75 | 21 | 11 | 11 | 23 | 191 | 45.5 | 111 | 34.2 | 22 | 72.7 | 56.8 | -82.0 |
| Pacome DadietF · 21 | $2.8M | 28 | 0 | 138 | 48 | 27 | 12 | 3 | 1 | 3 | 48 | 33.3 | 32 | 21.9 | 11 | 81.8 | 45.4 | -5.0 |
| James WisemanC · 25 · with IND | $2.7M | 4 | 1 | 59 | 13 | 8 | 3 | 0 | 1 | 5 | 10 | 60.0 | 0 | – | 2 | 50.0 | 59.7 | -9.0 |
| Jaden AkinsG · 23 | – | no games | ||||||||||||||||
| Tyler NickelF · 23 | – | no games | ||||||||||||||||
Today's roster. Last season shows each player's numbers wherever he played ("with ..." when it was another team). Salary is the season shown. TS% = true shooting (scoring efficiency including threes and free throws).
Five-man lineups
| Lineup | MIN | GP | ORtg | DRtg | Net |
|---|---|---|---|---|---|
| Hart · Towns · Bridges · Brunson · Anunoby | 127 | 10 | 100.2 | 108.6 | -8.4 |
| Towns · Bridges · Shamet · Brunson · Anunoby | 48 | 6 | 120.0 | 97.0 | +23.0 |
| Hart · Shamet · Brunson · McBride · Drummond | 36 | 10 | 111.5 | 90.3 | +21.2 |
| Towns · Shamet · Brunson · Anunoby · McBride | 23 | 8 | 125.3 | 101.5 | +23.8 |
| Shamet · Brunson · McBride · Diawara · Drummond | 22 | 5 | 115.2 | 103.9 | +11.3 |
| Towns · Shamet · Anunoby · McBride · Kolek | 20 | 6 | 143.7 | 93.4 | +50.3 |
| Hart · Towns · Shamet · Brunson · Anunoby | 19 | 7 | 136.6 | 86.7 | +49.9 |
| Towns · Bridges · Brunson · Anunoby · McBride | 18 | 7 | 116.1 | 102.6 | +13.5 |
| Lineup | MIN | GP | ORtg | DRtg | Net |
|---|---|---|---|---|---|
| Towns · Shamet · Anunoby · McBride · Kolek | 20 | 6 | 143.7 | 93.4 | +50.3 |
| Hart · Towns · Shamet · Brunson · Anunoby | 19 | 7 | 136.6 | 86.7 | +49.9 |
| Towns · Shamet · Brunson · Anunoby · McBride | 23 | 8 | 125.3 | 101.5 | +23.8 |
| Towns · Bridges · Shamet · Brunson · Anunoby | 48 | 6 | 120.0 | 97.0 | +23.0 |
| Hart · Shamet · Brunson · McBride · Drummond | 36 | 10 | 111.5 | 90.3 | +21.2 |
| Clarkson · Towns · Bridges · Anunoby · Kolek | 17 | 4 | 110.4 | 95.9 | +14.5 |
| Towns · Bridges · Brunson · Anunoby · McBride | 18 | 7 | 116.1 | 102.6 | +13.5 |
| Shamet · Brunson · McBride · Diawara · Drummond | 22 | 5 | 115.2 | 103.9 | +11.3 |
| Lineup | MIN | GP | ORtg | DRtg | Net |
|---|---|---|---|---|---|
| Hart · Towns · Bridges · Brunson · Anunoby | 553 | 44 | 115.3 | 114.3 | +1.0 |
| Hart · Towns · Bridges · Brunson · McBride | 123 | 16 | 134.2 | 114.9 | +19.3 |
| Towns · Bridges · Shamet · Brunson · Anunoby | 119 | 20 | 110.3 | 110.6 | -0.4 |
| Towns · Bridges · Brunson · Anunoby · McBride | 91 | 13 | 131.3 | 131.9 | -0.5 |
| Hart · Towns · Bridges · Shamet · Brunson | 84 | 15 | 111.9 | 109.7 | +2.2 |
| Hart · Bridges · Brunson · Anunoby · Robinson | 70 | 17 | 136.9 | 114.0 | +22.9 |
| Clarkson · Towns · Bridges · Anunoby · Kolek | 63 | 14 | 111.5 | 111.5 | +0.0 |
| Towns · Bridges · Brunson · Anunoby · Robinson | 52 | 9 | 116.1 | 107.6 | +8.4 |
| Lineup | MIN | GP | ORtg | DRtg | Net |
|---|---|---|---|---|---|
| Hart · Bridges · Brunson · Anunoby · Robinson | 70 | 17 | 136.9 | 114.0 | +22.9 |
| Hart · Towns · Bridges · Brunson · McBride | 123 | 16 | 134.2 | 114.9 | +19.3 |
| Hart · Towns · Bridges · Shamet · Brunson | 84 | 15 | 111.9 | 109.7 | +2.2 |
| Hart · Towns · Bridges · Brunson · Anunoby | 553 | 44 | 115.3 | 114.3 | +1.0 |
| Clarkson · Towns · Bridges · Anunoby · Kolek | 63 | 14 | 111.5 | 111.5 | +0.0 |
| Towns · Bridges · Shamet · Brunson · Anunoby | 119 | 20 | 110.3 | 110.6 | -0.4 |
| Towns · Bridges · Brunson · Anunoby · McBride | 91 | 13 | 131.3 | 131.9 | -0.5 |
Every stretch with the same five on the floor, from play-by-play. ORtg/DRtg = points scored/allowed per 100 possessions with that lineup; Net = the difference. "Best" ranks lineups with at least 15 minutes together this season (60 last season); small samples swing a lot.
Rotation & usage
Darker = on the court more often in that 3-minute stretch of regulation (share of the games he played), which shows who starts, who closes and when the bench comes in. Usage = share of the team's plays he finishes with a shot, free throws or a turnover while on court (about 20% is average; stars run 30% or more).
Impact (lineup model)
| Player | Offense | Defense | Net | Team ORtg on court | Team DRtg on court | Possessions |
|---|---|---|---|---|---|---|
| Karl-Anthony TownsC · 31 | +2.8 | +0.7 | +3.5 | 117.7 | 110.7 | 6,370 |
| Miles McBrideG · 26 | +1.7 | +1.8 | +3.5 | 117.2 | 108.6 | 3,336 |
| OG AnunobyF · 29 | +2.1 | +1.2 | +3.3 | 117.5 | 110.7 | 6,338 |
| Landry ShametG · 29 | -0.1 | +3.2 | +3.1 | 115.0 | 105.7 | 2,967 |
| Jalen BrunsonG · 30 | +2.5 | -1.0 | +1.5 | 117.2 | 112.5 | 6,608 |
| Tyler KolekG · 25 | -0.4 | +1.8 | +1.4 | 113.2 | 105.8 | 1,626 |
| Mohamed DiawaraF · 21 | +0.6 | +0.5 | +1.0 | 116.2 | 109.0 | 1,023 |
| Mikal BridgesG · 30 | -0.3 | +0.8 | +0.5 | 115.7 | 111.0 | 7,049 |
| Jordan ClarksonG · 34 | +0.0 | +0.4 | +0.5 | 113.5 | 111.4 | 2,905 |
| Jose AlvaradoG · 28 | -0.8 | +0.8 | +0.0 | 109.9 | 112.6 | 3,197 |
| Josh HartG · 31 | -0.1 | +0.1 | -0.1 | 115.5 | 111.5 | 5,872 |
| Andre DrummondC · 33 | -2.3 | +0.9 | -1.4 | 107.6 | 111.8 | 2,759 |
| Dalton KnechtF · 25 | -0.8 | -1.5 | -2.3 | 110.3 | 115.5 | 2,075 |
Points per 100 possessions a player adds on offense and saves on defense, separated from the teammates and opponents he shared the court with (last three seasons, recent ones weighted more). Positive = better on both. On-court ratings are the team's points scored/allowed per 100 possessions while he plays. Players with fewer than 500 possessions aren't rated.
Value for money
Best value
- Miles McBride · $4.0M · net +3.5 (+8.8 per $10M)
- Tyler Kolek · $2.3M · net +1.4 (+6.2 per $10M)
- Landry Shamet · $5.4M · net +3.1 (+5.8 per $10M)
Least impact for the money ($10M+)
- Josh Hart · $20.9M · net -0.1
- Mikal Bridges · $33.5M · net +0.5
- Jalen Brunson · $37.7M · net +1.5
Net impact from the lineup model vs this season's salary. Above the dashed line = makes the team better. Players with fewer than 1000 possessions over three seasons aren't shown.
Contracts
Payroll $220.4M · 1st highest in NBA
| Player | Salary | Share of payroll | Years left |
|---|---|---|---|
| Karl-Anthony TownsC · 31 | $57.1M | 26% | 2 |
| OG AnunobyF · 29 | $42.5M | 19% | 3 |
| Jalen BrunsonG · 30 | $37.7M | 17% | 3 |
| Mikal BridgesG · 30 | $33.5M | 15% | 4 |
| Josh HartG · 31 | $20.9M | 9% | 2 |
| Landry ShametG · 29 | $5.4M | 2% | 4 |
| Jose AlvaradoG · 28 | $4.5M | 2% | 3 |
| Dalton KnechtF · 25 | $4.2M | 2% | 1 |
| Miles McBrideG · 26 | $4.0M | 2% | 1 |
| Pacome DadietF · 21 | $3.0M | 1% | 2 |
| Jordan ClarksonG · 34 | $2.4M | 1% | 1 |
| Andre DrummondC · 33 | $2.4M | 1% | 1 |
| James WisemanC · 25 | $2.4M | 1% | 1 |
| Tyler KolekG · 25 | $2.3M | 1% | 2 |
| Mohamed DiawaraF · 21 | $2.2M | 1% | 4 |
| Jaden AkinsG · 23 | – | 0% | – |
| Tyler NickelF · 23 | – | 0% | – |
Salaries, contract years and payroll from the Basketball-Reference contract tables, exported 04 Nov 2026. Players without a contract there (mostly two-way deals, which don't count toward payroll) show ESPN's figure when it has one. Players waived but still paid are listed at the bottom.