
LA Clippers
All teams · Western Conference
Roster outlook (lineup model, healthy players): offense 113.3, defense 111.3 points per 100 possessions vs last season 114.9 / 113.7.
Injuries (4)
- Bradley Beal · Out — Beal (knee) will not be ready for the start of the regular season, NBA writer Justin Russo reports.
- Brandon Ingram · Out — Ingram (Achilles) won't play in Friday's game against the Thunder, per Law Murray of The Athletic.
- Jordan Miller · Out — Miller underwent surgery Wednesday to repair a torn left rotator cuff and will be re-evaluated in six months, per Law Murray of The Athletic.
- Yanic Konan Niederhauser · Out — Niederhauser (foot) is out for Tuesday's game against Phoenix, Ohm Youngmisuk of ESPN.com reports.
Players
| Player | Salary | GP | GS | MIN | PTS | REB | AST | STL | BLK | TOV | FGA | FG% | 3PA | 3P% | FTA | FT% | TS% | +/- |
|---|---|---|---|---|---|---|---|---|---|---|---|---|---|---|---|---|---|---|
 Darius GarlandG · 26 | $42.2M | 12 | 12 | 33.2 | 21.2 | 2.3 | 6.9 | 0.6 | 0.1 | 4.9 | 15.6 | 47.6 | 6.8 | 36.6 | 4.8 | 82.5 | 60.1 | -9.2 |
 Kris DunnG · 32 | $5.7M | 12 | 12 | 27.1 | 7.8 | 3.8 | 4.2 | 2.0 | 0.4 | 1.5 | 5.8 | 49.3 | 2.1 | 40.0 | 1.5 | 88.9 | 61.1 | -1.7 |
 Derrick Jones Jr.F · 29 | $10.5M | 11 | 11 | 28.9 | 11.5 | 4.8 | 1.3 | 1.0 | 1.1 | 1.3 | 8.0 | 53.4 | 4.2 | 52.2 | 1.3 | 64.3 | 67.4 | -5.1 |
 Brook LopezC · 38 | $9.2M | 12 | 6 | 24.5 | 14.1 | 5.3 | 1.8 | 0.5 | 0.9 | 1.0 | 10.3 | 54.0 | 3.5 | 40.5 | 2.5 | 60.0 | 61.6 | -0.5 |
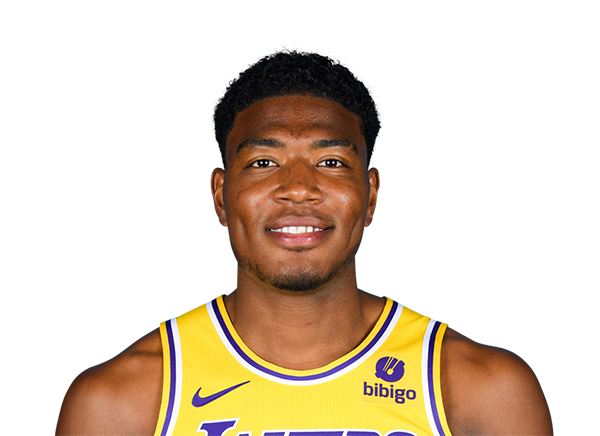 Rui HachimuraF · 28 | $14.0M | 10 | 10 | 29.0 | 12.6 | 6.0 | 1.6 | 1.0 | 0.1 | 1.8 | 12.0 | 36.7 | 5.8 | 32.8 | 2.8 | 67.9 | 47.6 | -7.1 |
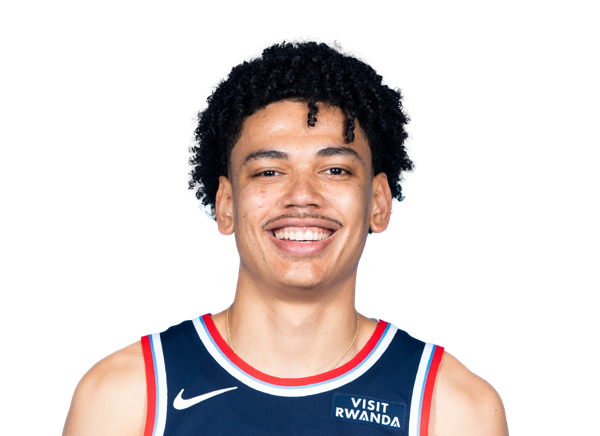 Kobe SandersG · 24 | $2.6M | 12 | 2 | 23.2 | 8.8 | 2.9 | 2.7 | 0.9 | 0.1 | 1.5 | 6.9 | 42.2 | 4.2 | 36.0 | 1.4 | 100.0 | 58.0 | +0.7 |
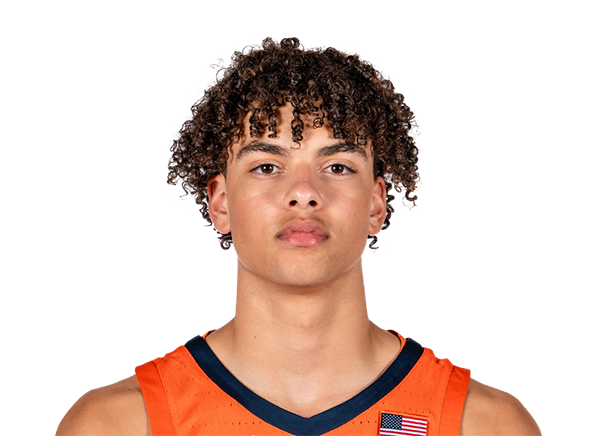 Keaton WaglerG · 19 | $9.7M | 12 | 0 | 23.2 | 12.3 | 3.4 | 3.3 | 0.8 | 0.2 | 1.9 | 8.2 | 35.4 | 4.8 | 36.8 | 5.5 | 86.4 | 57.8 | -0.2 |
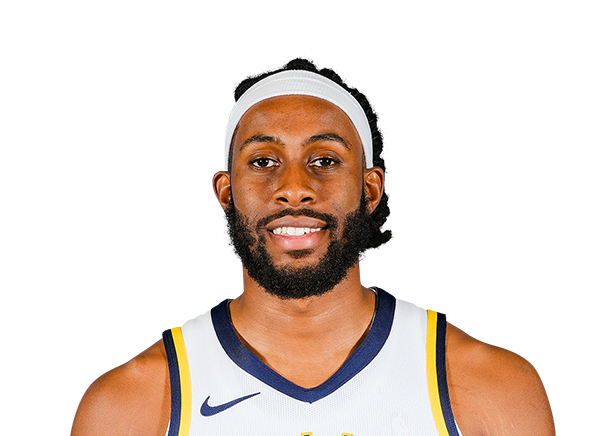 Isaiah JacksonF · 24 | $7.0M | 11 | 6 | 19.7 | 8.3 | 5.3 | 2.1 | 1.2 | 0.9 | 1.6 | 6.0 | 57.6 | 0.4 | 50.0 | 1.8 | 65.0 | 60.8 | -5.3 |
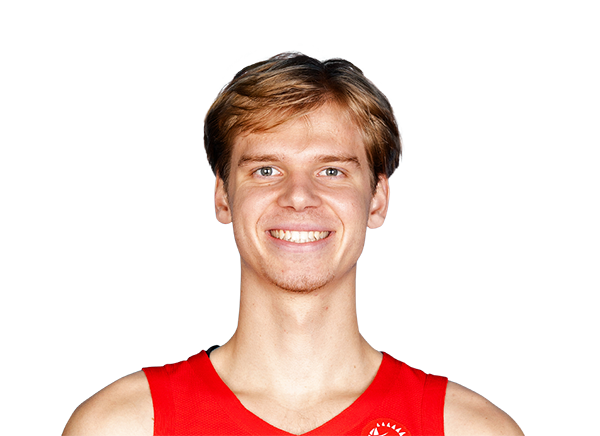 Gradey DickG · 22 | $7.1M | 12 | 1 | 16.1 | 8.2 | 2.9 | 0.6 | 0.6 | 0.2 | 0.8 | 5.6 | 55.2 | 1.9 | 52.2 | 1.3 | 75.0 | 66.2 | +1.9 |
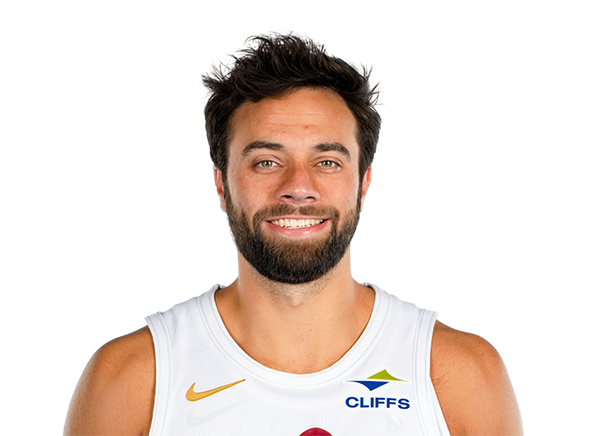 Max StrusG · 30 | $16.7M | 6 | 0 | 22.5 | 9.3 | 3.5 | 3.8 | 1.0 | 0.0 | 0.5 | 8.5 | 37.3 | 6.2 | 35.1 | 1.0 | 83.3 | 52.2 | +0.0 |
 Baba MillerF · 22 | $1.7M | 10 | 0 | 9.8 | 4.3 | 2.4 | 0.9 | 0.5 | 0.7 | 0.8 | 2.5 | 56.0 | 0.6 | 33.3 | 1.6 | 81.2 | 67.1 | +0.7 |
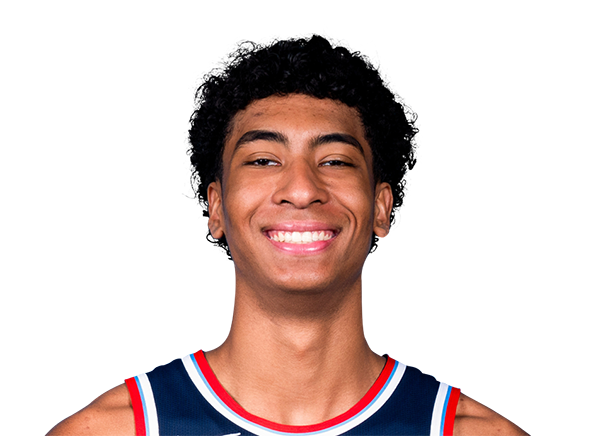 Cam ChristieG · 21 | $2.3M | 5 | 0 | 5.8 | 1.4 | 0.4 | 0.2 | 0.2 | 0.0 | 0.6 | 2.2 | 18.2 | 0.8 | 25.0 | 0.4 | 100.0 | 29.5 | +0.4 |
 Jalen PickettG · 27 | $2.4M | 5 | 0 | 5.2 | 2.0 | 0.8 | 1.0 | 0.4 | 0.0 | 0.2 | 1.6 | 50.0 | 0.6 | 66.7 | 0.0 | – | 62.5 | +4.6 |
 Nick MartinelliF · 22 | – | 5 | 0 | 4.2 | 3.4 | 1.4 | 0.4 | 0.0 | 0.0 | 0.4 | 2.2 | 63.6 | 0.6 | 66.7 | 0.2 | 100.0 | 74.3 | +1.4 |
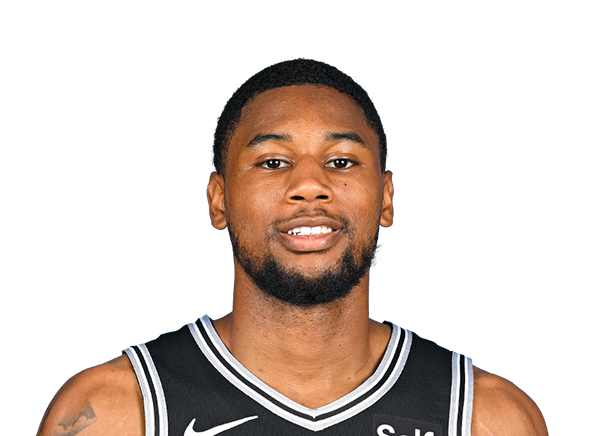 Blake WesleyG · 23 | – | 2 | 0 | 4.5 | 1.0 | 2.0 | 0.0 | 0.0 | 0.0 | 0.0 | 2.0 | 0.0 | 1.0 | 0.0 | 1.0 | 100.0 | 20.5 | +1.5 |
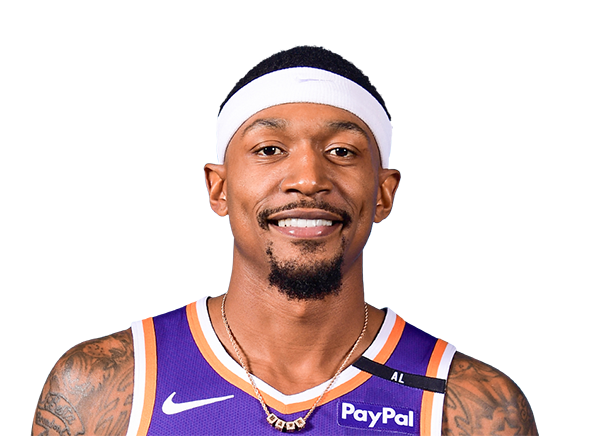 Bradley BealG · 33 | $6.4M | no games | ||||||||||||||||
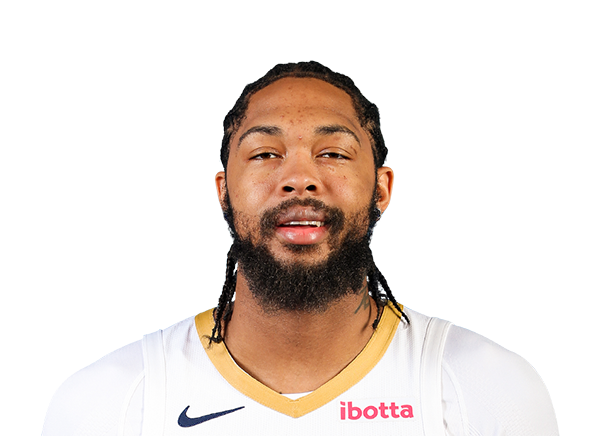 Brandon IngramF · 29 | $40.0M | no games | ||||||||||||||||
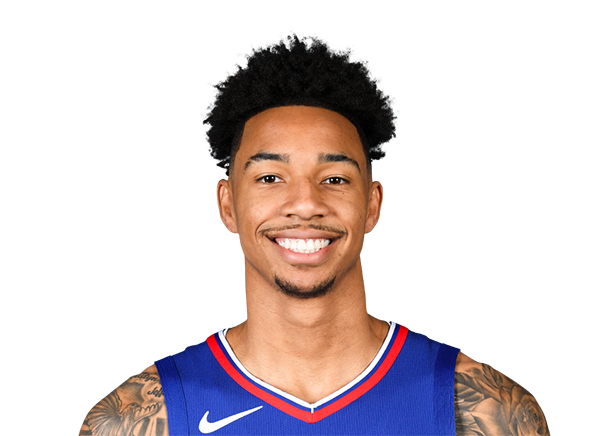 Jordan MillerG · 26 | $5.3M | no games | ||||||||||||||||
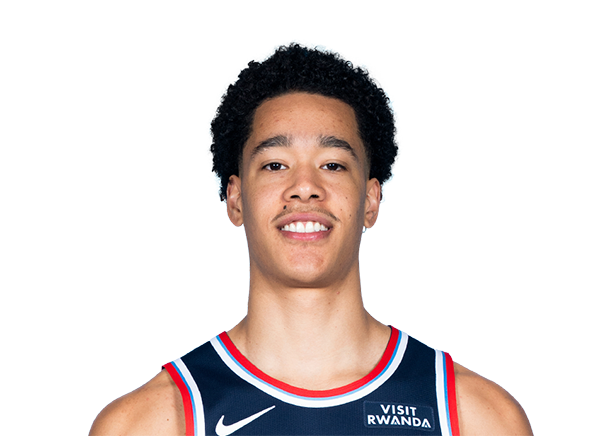 Yanic Konan NiederhauserC · 23 | $2.9M | no games | ||||||||||||||||
| Player | Salary | GP | GS | MIN | PTS | REB | AST | STL | BLK | TOV | FGA | FG% | 3PA | 3P% | FTA | FT% | TS% | +/- |
|---|---|---|---|---|---|---|---|---|---|---|---|---|---|---|---|---|---|---|
| Darius GarlandG · 26 | $42.2M | 12 | 12 | 33.2 | 23.0 | 2.5 | 7.5 | 0.6 | 0.1 | 5.3 | 16.9 | 47.6 | 7.4 | 36.6 | 5.1 | 82.5 | 60.1 | -9.9 |
| Kris DunnG · 32 | $5.7M | 12 | 12 | 27.1 | 10.4 | 5.1 | 5.5 | 2.7 | 0.6 | 2.0 | 7.6 | 49.3 | 2.8 | 40.0 | 2.0 | 88.9 | 61.1 | -2.2 |
| Derrick Jones Jr.F · 29 | $10.5M | 11 | 11 | 28.9 | 14.4 | 6.0 | 1.6 | 1.2 | 1.4 | 1.6 | 10.0 | 53.4 | 5.2 | 52.2 | 1.6 | 64.3 | 67.4 | -6.3 |
| Brook LopezC · 38 | $9.2M | 12 | 6 | 24.5 | 20.7 | 7.8 | 2.7 | 0.7 | 1.3 | 1.5 | 15.2 | 54.0 | 5.1 | 40.5 | 3.7 | 60.0 | 61.6 | -0.7 |
| Rui HachimuraF · 28 | $14.0M | 10 | 10 | 29.0 | 15.6 | 7.4 | 2.0 | 1.2 | 0.1 | 2.2 | 14.9 | 36.7 | 7.2 | 32.8 | 3.5 | 67.9 | 47.6 | -8.8 |
| Kobe SandersG · 24 | $2.6M | 12 | 2 | 23.2 | 13.6 | 4.5 | 4.1 | 1.4 | 0.1 | 2.3 | 10.7 | 42.2 | 6.5 | 36.0 | 2.2 | 100.0 | 58.0 | +1.0 |
| Keaton WaglerG · 19 | $9.7M | 12 | 0 | 23.2 | 19.2 | 5.3 | 5.2 | 1.2 | 0.3 | 3.0 | 12.8 | 35.4 | 7.4 | 36.8 | 8.5 | 86.4 | 57.8 | -0.3 |
| Isaiah JacksonF · 24 | $7.0M | 11 | 6 | 19.7 | 15.1 | 9.6 | 3.8 | 2.2 | 1.7 | 3.0 | 10.9 | 57.6 | 0.7 | 50.0 | 3.3 | 65.0 | 60.8 | -9.6 |
| Gradey DickG · 22 | $7.1M | 12 | 1 | 16.1 | 18.3 | 6.5 | 1.3 | 1.3 | 0.4 | 1.7 | 12.5 | 55.2 | 4.3 | 52.2 | 3.0 | 75.0 | 66.2 | +4.3 |
| Max StrusG · 30 | $16.7M | 6 | 0 | 22.5 | 14.9 | 5.6 | 6.1 | 1.6 | 0.0 | 0.8 | 13.6 | 37.3 | 9.9 | 35.1 | 1.6 | 83.3 | 52.2 | +0.0 |
| Baba MillerF · 22 | $1.7M | 10 | 0 | 9.8 | 15.8 | 8.8 | 3.3 | 1.8 | 2.6 | 2.9 | 9.2 | 56.0 | 2.2 | 33.3 | 5.9 | 81.2 | 67.1 | +2.6 |
| Cam ChristieG · 21 | $2.3M | 5 | 0 | 5.8 | 8.7 | 2.5 | 1.2 | 1.2 | 0.0 | 3.7 | 13.7 | 18.2 | 5.0 | 25.0 | 2.5 | 100.0 | 29.5 | +2.5 |
| Jalen PickettG · 27 | $2.4M | 5 | 0 | 5.2 | 13.8 | 5.5 | 6.9 | 2.8 | 0.0 | 1.4 | 11.1 | 50.0 | 4.2 | 66.7 | 0.0 | – | 62.5 | +31.8 |
| Nick MartinelliF · 22 | – | 5 | 0 | 4.2 | 29.1 | 12.0 | 3.4 | 0.0 | 0.0 | 3.4 | 18.9 | 63.6 | 5.1 | 66.7 | 1.7 | 100.0 | 74.3 | +12.0 |
| Blake WesleyG · 23 | – | 2 | 0 | 4.5 | 8.0 | 16.0 | 0.0 | 0.0 | 0.0 | 0.0 | 16.0 | 0.0 | 8.0 | 0.0 | 8.0 | 100.0 | 20.5 | +12.0 |
| Bradley BealG · 33 | $6.4M | no games | ||||||||||||||||
| Brandon IngramF · 29 | $40.0M | no games | ||||||||||||||||
| Jordan MillerG · 26 | $5.3M | no games | ||||||||||||||||
| Yanic Konan NiederhauserC · 23 | $2.9M | no games | ||||||||||||||||
| Player | Salary | GP | GS | MIN | PTS | REB | AST | STL | BLK | TOV | FGA | FG% | 3PA | 3P% | FTA | FT% | TS% | +/- |
|---|---|---|---|---|---|---|---|---|---|---|---|---|---|---|---|---|---|---|
| Darius GarlandG · 26 | $42.2M | 12 | 12 | 399 | 255 | 28 | 83 | 7 | 1 | 59 | 187 | 47.6 | 82 | 36.6 | 57 | 82.5 | 60.1 | -110.0 |
| Kris DunnG · 32 | $5.7M | 12 | 12 | 325 | 94 | 46 | 50 | 24 | 5 | 18 | 69 | 49.3 | 25 | 40.0 | 18 | 88.9 | 61.1 | -20.0 |
| Derrick Jones Jr.F · 29 | $10.5M | 11 | 11 | 318 | 127 | 53 | 14 | 11 | 12 | 14 | 88 | 53.4 | 46 | 52.2 | 14 | 64.3 | 67.4 | -56.0 |
| Brook LopezC · 38 | $9.2M | 12 | 6 | 294 | 169 | 64 | 22 | 6 | 11 | 12 | 124 | 54.0 | 42 | 40.5 | 30 | 60.0 | 61.6 | -6.0 |
| Rui HachimuraF · 28 | $14.0M | 10 | 10 | 290 | 126 | 60 | 16 | 10 | 1 | 18 | 120 | 36.7 | 58 | 32.8 | 28 | 67.9 | 47.6 | -71.0 |
| Kobe SandersG · 24 | $2.6M | 12 | 2 | 278 | 105 | 35 | 32 | 11 | 1 | 18 | 83 | 42.2 | 50 | 36.0 | 17 | 100.0 | 58.0 | +8.0 |
| Keaton WaglerG · 19 | $9.7M | 12 | 0 | 278 | 148 | 41 | 40 | 9 | 2 | 23 | 99 | 35.4 | 57 | 36.8 | 66 | 86.4 | 57.8 | -2.0 |
| Isaiah JacksonF · 24 | $7.0M | 11 | 6 | 217 | 91 | 58 | 23 | 13 | 10 | 18 | 66 | 57.6 | 4 | 50.0 | 20 | 65.0 | 60.8 | -58.0 |
| Gradey DickG · 22 | $7.1M | 12 | 1 | 193 | 98 | 35 | 7 | 7 | 2 | 9 | 67 | 55.2 | 23 | 52.2 | 16 | 75.0 | 66.2 | +23.0 |
| Max StrusG · 30 | $16.7M | 6 | 0 | 135 | 56 | 21 | 23 | 6 | 0 | 3 | 51 | 37.3 | 37 | 35.1 | 6 | 83.3 | 52.2 | +0.0 |
| Baba MillerF · 22 | $1.7M | 10 | 0 | 98 | 43 | 24 | 9 | 5 | 7 | 8 | 25 | 56.0 | 6 | 33.3 | 16 | 81.2 | 67.1 | +7.0 |
| Cam ChristieG · 21 | $2.3M | 5 | 0 | 29 | 7 | 2 | 1 | 1 | 0 | 3 | 11 | 18.2 | 4 | 25.0 | 2 | 100.0 | 29.5 | +2.0 |
| Jalen PickettG · 27 | $2.4M | 5 | 0 | 26 | 10 | 4 | 5 | 2 | 0 | 1 | 8 | 50.0 | 3 | 66.7 | 0 | – | 62.5 | +23.0 |
| Nick MartinelliF · 22 | – | 5 | 0 | 21 | 17 | 7 | 2 | 0 | 0 | 2 | 11 | 63.6 | 3 | 66.7 | 1 | 100.0 | 74.3 | +7.0 |
| Blake WesleyG · 23 | – | 2 | 0 | 9 | 2 | 4 | 0 | 0 | 0 | 0 | 4 | 0.0 | 2 | 0.0 | 2 | 100.0 | 20.5 | +3.0 |
| Bradley BealG · 33 | $6.4M | no games | ||||||||||||||||
| Brandon IngramF · 29 | $40.0M | no games | ||||||||||||||||
| Jordan MillerG · 26 | $5.3M | no games | ||||||||||||||||
| Yanic Konan NiederhauserC · 23 | $2.9M | no games | ||||||||||||||||
| Player | Salary | GP | GS | MIN | PTS | REB | AST | STL | BLK | TOV | FGA | FG% | 3PA | 3P% | FTA | FT% | TS% | +/- |
|---|---|---|---|---|---|---|---|---|---|---|---|---|---|---|---|---|---|---|
| Brandon IngramF · 29 · with TOR/? | $38.1M | 79 | 77 | 33.1 | 20.9 | 5.5 | 3.6 | 0.7 | 0.7 | 2.4 | 16.3 | 47.6 | 4.5 | 38.1 | 4.5 | 82.0 | 57.2 | +0.6 |
| Kris DunnG · 32 | $5.4M | 82 | 68 | 27.2 | 7.3 | 3.3 | 3.6 | 1.6 | 0.2 | 1.4 | 5.8 | 47.6 | 2.6 | 37.4 | 1.0 | 76.5 | 58.1 | +0.2 |
| Rui HachimuraF · 28 · with LAL | $18.3M | 68 | 41 | 28.3 | 11.5 | 3.3 | 0.8 | 0.6 | 0.3 | 0.6 | 8.8 | 51.4 | 3.9 | 44.3 | 1.1 | 69.4 | 62.0 | +1.2 |
| Brook LopezC · 38 | $8.8M | 75 | 40 | 21.8 | 8.5 | 3.6 | 1.3 | 0.6 | 1.2 | 0.8 | 7.2 | 42.8 | 4.2 | 36.0 | 1.0 | 75.7 | 55.2 | +0.6 |
| Kobe SandersG · 24 | $0K | 68 | 16 | 19.9 | 7.3 | 2.2 | 1.6 | 0.7 | 0.1 | 1.2 | 5.6 | 46.6 | 2.9 | 40.8 | 1.0 | 82.6 | 59.7 | +0.5 |
| Derrick Jones Jr.F · 29 | $10.0M | 50 | 45 | 26.9 | 10.1 | 3.5 | 1.4 | 0.9 | 1.0 | 0.8 | 7.6 | 49.9 | 3.1 | 35.9 | 1.9 | 76.3 | 60.0 | +2.6 |
| Darius GarlandG · 26 · with CLE/LAC | $39.4M | 45 | 43 | 29.8 | 18.8 | 2.4 | 6.7 | 1.0 | 0.2 | 2.9 | 14.9 | 46.0 | 6.8 | 39.6 | 2.7 | 86.1 | 58.2 | +1.9 |
| Jordan MillerG · 26 | $713K | 60 | 1 | 22.0 | 10.0 | 3.0 | 2.3 | 0.8 | 0.2 | 1.1 | 6.6 | 53.1 | 1.8 | 34.5 | 2.9 | 77.7 | 62.8 | -0.2 |
| Gradey DickG · 22 · with TOR | $5.0M | 76 | 1 | 14.0 | 6.0 | 1.9 | 0.7 | 0.6 | 0.1 | 0.6 | 5.1 | 41.9 | 2.4 | 30.1 | 1.2 | 87.5 | 53.8 | +1.6 |
| Isaiah JacksonF · 24 · with IND/LAC | $7.0M | 55 | 14 | 16.5 | 6.7 | 5.3 | 0.9 | 0.7 | 0.9 | 1.1 | 4.3 | 63.7 | 0.1 | 0.0 | 1.9 | 64.8 | 65.3 | -0.9 |
| Jalen PickettG · 27 · with DEN | $2.2M | 50 | 18 | 16.1 | 5.2 | 2.3 | 2.3 | 0.3 | 0.1 | 0.7 | 4.6 | 42.2 | 2.5 | 38.6 | 0.4 | 78.9 | 54.1 | +0.1 |
| Cam ChristieG · 21 | $2.0M | 54 | 0 | 8.9 | 2.9 | 1.4 | 0.6 | 0.3 | 0.1 | 0.4 | 2.6 | 38.1 | 0.9 | 24.5 | 0.9 | 76.0 | 48.4 | -0.2 |
| Yanic Konan NiederhauserC · 23 | $2.7M | 40 | 0 | 10.6 | 4.4 | 2.9 | 0.3 | 0.1 | 0.8 | 0.6 | 2.5 | 64.0 | 0.1 | 20.0 | 1.6 | 75.8 | 69.1 | +1.0 |
| Blake WesleyG · 23 · with POR | $4.7M | 31 | 0 | 11.7 | 4.8 | 1.3 | 2.0 | 0.5 | 0.2 | 1.0 | 4.0 | 45.2 | 1.2 | 27.8 | 1.5 | 55.3 | 51.1 | -2.5 |
| Max StrusG · 30 · with CLE | $15.9M | 12 | 5 | 24.0 | 11.2 | 5.4 | 2.0 | 0.2 | 0.0 | 0.8 | 8.8 | 44.3 | 6.8 | 40.2 | 0.8 | 77.8 | 60.9 | -0.2 |
| Bradley BealG · 33 | $5.4M | 6 | 6 | 20.2 | 8.2 | 0.8 | 1.7 | 0.5 | 0.0 | 1.5 | 8.0 | 37.5 | 3.2 | 36.8 | 1.3 | 75.0 | 47.6 | -3.8 |
| Nick MartinelliF · 22 | – | no games | ||||||||||||||||
| Baba MillerF · 22 | – | no games | ||||||||||||||||
| Keaton WaglerG · 19 | – | no games | ||||||||||||||||
| Player | Salary | GP | GS | MIN | PTS | REB | AST | STL | BLK | TOV | FGA | FG% | 3PA | 3P% | FTA | FT% | TS% | +/- |
|---|---|---|---|---|---|---|---|---|---|---|---|---|---|---|---|---|---|---|
| Brandon IngramF · 29 · with TOR/? | $38.1M | 79 | 77 | 33.1 | 22.8 | 6.0 | 3.9 | 0.8 | 0.8 | 2.6 | 17.8 | 47.6 | 4.9 | 38.1 | 4.9 | 82.0 | 57.2 | +0.7 |
| Kris DunnG · 32 | $5.4M | 82 | 68 | 27.2 | 9.6 | 4.4 | 4.8 | 2.1 | 0.2 | 1.8 | 7.7 | 47.6 | 3.5 | 37.4 | 1.3 | 76.5 | 58.1 | +0.2 |
| Rui HachimuraF · 28 · with LAL | $18.3M | 68 | 41 | 28.3 | 14.6 | 4.2 | 1.1 | 0.7 | 0.4 | 0.8 | 11.2 | 51.4 | 4.9 | 44.3 | 1.3 | 69.4 | 62.0 | +1.5 |
| Brook LopezC · 38 | $8.8M | 75 | 40 | 21.8 | 14.0 | 6.0 | 2.1 | 1.0 | 1.9 | 1.3 | 11.9 | 42.8 | 7.0 | 36.0 | 1.6 | 75.7 | 55.2 | +0.9 |
| Kobe SandersG · 24 | $0K | 68 | 16 | 19.9 | 13.2 | 4.1 | 2.9 | 1.3 | 0.3 | 2.2 | 10.2 | 46.6 | 5.2 | 40.8 | 1.8 | 82.6 | 59.7 | +0.9 |
| Derrick Jones Jr.F · 29 | $10.0M | 50 | 45 | 26.9 | 13.5 | 4.6 | 1.8 | 1.2 | 1.3 | 1.1 | 10.1 | 49.9 | 4.1 | 35.9 | 2.5 | 76.3 | 60.0 | +3.5 |
| Darius GarlandG · 26 · with CLE/LAC | $39.4M | 45 | 43 | 29.8 | 22.7 | 2.9 | 8.1 | 1.2 | 0.2 | 3.5 | 18.0 | 46.0 | 8.3 | 39.6 | 3.3 | 86.1 | 58.2 | +2.3 |
| Jordan MillerG · 26 | $713K | 60 | 1 | 22.0 | 16.3 | 5.0 | 3.7 | 1.2 | 0.3 | 1.7 | 10.9 | 53.1 | 3.0 | 34.5 | 4.8 | 77.7 | 62.8 | -0.4 |
| Gradey DickG · 22 · with TOR | $5.0M | 76 | 1 | 14.0 | 15.4 | 5.0 | 1.7 | 1.5 | 0.2 | 1.4 | 13.0 | 41.9 | 6.3 | 30.1 | 3.0 | 87.5 | 53.8 | +4.1 |
| Isaiah JacksonF · 24 · with IND/LAC | $7.0M | 55 | 14 | 16.5 | 14.7 | 11.5 | 2.1 | 1.4 | 1.9 | 2.3 | 9.4 | 63.7 | 0.1 | 0.0 | 4.2 | 64.8 | 65.3 | -2.0 |
| Jalen PickettG · 27 · with DEN | $2.2M | 50 | 18 | 16.1 | 11.6 | 5.1 | 5.1 | 0.6 | 0.2 | 1.5 | 10.4 | 42.2 | 5.7 | 38.6 | 0.8 | 78.9 | 54.1 | +0.1 |
| Cam ChristieG · 21 | $2.0M | 54 | 0 | 8.9 | 11.7 | 5.9 | 2.3 | 1.2 | 0.2 | 1.7 | 10.4 | 38.1 | 3.7 | 24.5 | 3.8 | 76.0 | 48.4 | -0.8 |
| Yanic Konan NiederhauserC · 23 | $2.7M | 40 | 0 | 10.6 | 14.9 | 9.9 | 1.0 | 0.4 | 2.5 | 1.9 | 8.5 | 64.0 | 0.4 | 20.0 | 5.3 | 75.8 | 69.1 | +3.4 |
| Blake WesleyG · 23 · with POR | $4.7M | 31 | 0 | 11.7 | 14.7 | 3.9 | 6.1 | 1.6 | 0.5 | 3.1 | 12.3 | 45.2 | 3.6 | 27.8 | 4.7 | 55.3 | 51.1 | -7.7 |
| Max StrusG · 30 · with CLE | $15.9M | 12 | 5 | 24.0 | 16.8 | 8.1 | 3.0 | 0.4 | 0.0 | 1.1 | 13.2 | 44.3 | 10.2 | 40.2 | 1.1 | 77.8 | 60.9 | -0.4 |
| Bradley BealG · 33 | $5.4M | 6 | 6 | 20.2 | 14.6 | 1.5 | 3.0 | 0.9 | 0.0 | 2.7 | 14.3 | 37.5 | 5.7 | 36.8 | 2.4 | 75.0 | 47.6 | -6.8 |
| Nick MartinelliF · 22 | – | no games | ||||||||||||||||
| Baba MillerF · 22 | – | no games | ||||||||||||||||
| Keaton WaglerG · 19 | – | no games | ||||||||||||||||
| Player | Salary | GP | GS | MIN | PTS | REB | AST | STL | BLK | TOV | FGA | FG% | 3PA | 3P% | FTA | FT% | TS% | +/- |
|---|---|---|---|---|---|---|---|---|---|---|---|---|---|---|---|---|---|---|
| Brandon IngramF · 29 · with TOR/? | $38.1M | 79 | 77 | 2611 | 1655 | 433 | 285 | 58 | 55 | 187 | 1291 | 47.6 | 354 | 38.1 | 356 | 82.0 | 57.2 | +50.0 |
| Kris DunnG · 32 | $5.4M | 82 | 68 | 2232 | 596 | 271 | 295 | 131 | 14 | 111 | 477 | 47.6 | 214 | 37.4 | 81 | 76.5 | 58.1 | +15.0 |
| Rui HachimuraF · 28 · with LAL | $18.3M | 68 | 41 | 1927 | 780 | 226 | 57 | 39 | 21 | 42 | 597 | 51.4 | 262 | 44.3 | 72 | 69.4 | 62.0 | +81.0 |
| Brook LopezC · 38 | $8.8M | 75 | 40 | 1635 | 634 | 273 | 97 | 45 | 87 | 61 | 542 | 42.8 | 317 | 36.0 | 74 | 75.7 | 55.2 | +42.0 |
| Kobe SandersG · 24 | $0K | 68 | 16 | 1353 | 495 | 153 | 109 | 49 | 10 | 81 | 384 | 46.6 | 196 | 40.8 | 69 | 82.6 | 59.7 | +32.0 |
| Derrick Jones Jr.F · 29 | $10.0M | 50 | 45 | 1347 | 504 | 173 | 69 | 45 | 50 | 40 | 379 | 49.9 | 153 | 35.9 | 93 | 76.3 | 60.0 | +130.0 |
| Darius GarlandG · 26 · with CLE/LAC | $39.4M | 45 | 43 | 1342 | 845 | 107 | 301 | 43 | 8 | 130 | 672 | 46.0 | 308 | 39.6 | 122 | 86.1 | 58.2 | +84.0 |
| Jordan MillerG · 26 | $713K | 60 | 1 | 1322 | 598 | 182 | 136 | 45 | 11 | 63 | 399 | 53.1 | 110 | 34.5 | 175 | 77.7 | 62.8 | -13.0 |
| Gradey DickG · 22 · with TOR | $5.0M | 76 | 1 | 1067 | 455 | 147 | 51 | 45 | 7 | 42 | 384 | 41.9 | 186 | 30.1 | 88 | 87.5 | 53.8 | +123.0 |
| Isaiah JacksonF · 24 · with IND/LAC | $7.0M | 55 | 14 | 908 | 370 | 290 | 52 | 36 | 49 | 58 | 237 | 63.7 | 3 | 0.0 | 105 | 64.8 | 65.3 | -50.0 |
| Jalen PickettG · 27 · with DEN | $2.2M | 50 | 18 | 806 | 260 | 114 | 115 | 13 | 5 | 34 | 232 | 42.2 | 127 | 38.6 | 19 | 78.9 | 54.1 | +3.0 |
| Cam ChristieG · 21 | $2.0M | 54 | 0 | 479 | 156 | 78 | 31 | 16 | 3 | 22 | 139 | 38.1 | 49 | 24.5 | 50 | 76.0 | 48.4 | -10.0 |
| Yanic Konan NiederhauserC · 23 | $2.7M | 40 | 0 | 425 | 176 | 117 | 12 | 5 | 30 | 23 | 100 | 64.0 | 5 | 20.0 | 62 | 75.8 | 69.1 | +40.0 |
| Blake WesleyG · 23 · with POR | $4.7M | 31 | 0 | 363 | 148 | 39 | 62 | 16 | 5 | 31 | 124 | 45.2 | 36 | 27.8 | 47 | 55.3 | 51.1 | -78.0 |
| Max StrusG · 30 · with CLE | $15.9M | 12 | 5 | 288 | 134 | 65 | 24 | 3 | 0 | 9 | 106 | 44.3 | 82 | 40.2 | 9 | 77.8 | 60.9 | -3.0 |
| Bradley BealG · 33 | $5.4M | 6 | 6 | 121 | 49 | 5 | 10 | 3 | 0 | 9 | 48 | 37.5 | 19 | 36.8 | 8 | 75.0 | 47.6 | -23.0 |
| Nick MartinelliF · 22 | – | no games | ||||||||||||||||
| Baba MillerF · 22 | – | no games | ||||||||||||||||
| Keaton WaglerG · 19 | – | no games | ||||||||||||||||
Today's roster. Last season shows each player's numbers wherever he played ("with ..." when it was another team). Salary is the season shown. TS% = true shooting (scoring efficiency including threes and free throws).
Five-man lineups
| Lineup | MIN | GP | ORtg | DRtg | Net |
|---|---|---|---|---|---|
| Dunn · Lopez · Jones Jr. · Hachimura · Garland | 88 | 7 | 105.0 | 119.8 | -14.8 |
| Dunn · Jones Jr. · Hachimura · Garland · Jackson | 83 | 8 | 109.4 | 109.4 | +0.0 |
| Dunn · Lopez · Sanders · Dick · Wagler | 36 | 5 | 114.3 | 85.4 | +28.9 |
| Strus · Jackson · Sanders · Dick · Wagler | 23 | 4 | 103.1 | 126.1 | -22.9 |
| Strus · Sanders · Miller · Dick · Wagler | 21 | 4 | 128.1 | 109.8 | +18.3 |
| Jones Jr. · Hachimura · Garland · Jackson · Sanders | 17 | 4 | 141.9 | 162.6 | -20.7 |
| Lopez · Garland · Sanders · Dick · Wagler | 16 | 7 | 125.1 | 113.4 | +11.6 |
| Lopez · Jones Jr. · Strus · Hachimura · Garland | 16 | 3 | 59.8 | 81.6 | -21.7 |
| Lineup | MIN | GP | ORtg | DRtg | Net |
|---|---|---|---|---|---|
| Dunn · Lopez · Sanders · Dick · Wagler | 36 | 5 | 114.3 | 85.4 | +28.9 |
| Strus · Sanders · Miller · Dick · Wagler | 21 | 4 | 128.1 | 109.8 | +18.3 |
| Lopez · Garland · Sanders · Dick · Wagler | 16 | 7 | 125.1 | 113.4 | +11.6 |
| Dunn · Jones Jr. · Hachimura · Garland · Jackson | 83 | 8 | 109.4 | 109.4 | +0.0 |
| Dunn · Jones Jr. · Garland · Jackson · Sanders | 15 | 1 | 97.6 | 107.0 | -9.4 |
| Dunn · Lopez · Jones Jr. · Hachimura · Garland | 88 | 7 | 105.0 | 119.8 | -14.8 |
| Jones Jr. · Hachimura · Garland · Jackson · Sanders | 17 | 4 | 141.9 | 162.6 | -20.7 |
| Lopez · Jones Jr. · Strus · Hachimura · Garland | 16 | 3 | 59.8 | 81.6 | -21.7 |
| Lineup | MIN | GP | ORtg | DRtg | Net |
|---|---|---|---|---|---|
| Dunn · Collins · Harden · Zubac · Leonard | 303 | 24 | 116.2 | 111.3 | +4.9 |
| Dunn · Lopez · Collins · Jones Jr. · Leonard | 141 | 12 | 111.3 | 109.1 | +2.1 |
| Lopez · Collins · Jones Jr. · Garland · Leonard | 106 | 7 | 121.6 | 108.3 | +13.3 |
| Dunn · Collins · Harden · Zubac · Sanders | 103 | 12 | 118.5 | 110.4 | +8.1 |
| Dunn · Lopez · Collins · Harden · Leonard | 93 | 12 | 118.7 | 115.4 | +3.3 |
| Dunn · Lopez · Jones Jr. · Garland · Leonard | 93 | 12 | 131.0 | 107.3 | +23.7 |
| Dunn · Lopez · Jones Jr. · Sanders · Leonard | 78 | 8 | 126.0 | 107.1 | +19.0 |
| Dunn · Batum · Collins · Harden · Zubac | 71 | 19 | 109.1 | 119.0 | -9.9 |
| Lineup | MIN | GP | ORtg | DRtg | Net |
|---|---|---|---|---|---|
| Dunn · Lopez · Jones Jr. · Garland · Leonard | 93 | 12 | 131.0 | 107.3 | +23.7 |
| Dunn · Lopez · Jones Jr. · Sanders · Leonard | 78 | 8 | 126.0 | 107.1 | +19.0 |
| Lopez · Collins · Jones Jr. · Garland · Leonard | 106 | 7 | 121.6 | 108.3 | +13.3 |
| Dunn · Collins · Harden · Zubac · Sanders | 103 | 12 | 118.5 | 110.4 | +8.1 |
| Dunn · Collins · Harden · Zubac · Leonard | 303 | 24 | 116.2 | 111.3 | +4.9 |
| Dunn · Lopez · Collins · Harden · Leonard | 93 | 12 | 118.7 | 115.4 | +3.3 |
| Dunn · Lopez · Collins · Jones Jr. · Leonard | 141 | 12 | 111.3 | 109.1 | +2.1 |
| Dunn · Collins · Jones Jr. · Harden · Zubac | 64 | 6 | 105.2 | 106.0 | -0.7 |
Every stretch with the same five on the floor, from play-by-play. ORtg/DRtg = points scored/allowed per 100 possessions with that lineup; Net = the difference. "Best" ranks lineups with at least 15 minutes together this season (60 last season); small samples swing a lot.
Rotation & usage
Darker = on the court more often in that 3-minute stretch of regulation (share of the games he played), which shows who starts, who closes and when the bench comes in. Usage = share of the team's plays he finishes with a shot, free throws or a turnover while on court (about 20% is average; stars run 30% or more).
Impact (lineup model)
| Player | Offense | Defense | Net | Team ORtg on court | Team DRtg on court | Possessions |
|---|---|---|---|---|---|---|
| Derrick Jones Jr.F · 29 | +1.2 | +0.8 | +2.0 | 114.4 | 111.2 | 4,164 |
| Kris DunnG · 32 | -0.5 | +1.8 | +1.3 | 112.4 | 110.3 | 5,329 |
| Kobe SandersG · 24 | +1.2 | -0.4 | +0.8 | 114.5 | 113.3 | 2,512 |
| Yanic Konan NiederhauserC · 23 | +0.3 | +0.5 | +0.8 | 115.6 | 110.5 | 593 |
| Jalen PickettG · 27 | -0.4 | +1.1 | +0.8 | 112.7 | 110.7 | 1,743 |
| Brook LopezC · 38 | -0.9 | +1.5 | +0.6 | 112.3 | 111.3 | 5,098 |
| Keaton WaglerG · 19 | +0.2 | +0.3 | +0.5 | 112.1 | 111.6 | 576 |
| Max StrusG · 30 | +0.5 | -0.1 | +0.4 | 117.4 | 112.7 | 1,787 |
| Gradey DickG · 22 | -0.5 | +0.7 | +0.2 | 110.6 | 110.3 | 3,323 |
| Cam ChristieG · 21 | -1.0 | +1.1 | +0.0 | 108.5 | 109.0 | 772 |
| Rui HachimuraF · 28 | -0.2 | +0.1 | -0.1 | 113.8 | 112.9 | 4,970 |
| Brandon IngramF · 29 | +0.4 | -0.7 | -0.3 | 112.5 | 112.4 | 4,242 |
| Isaiah JacksonF · 24 | +0.5 | -0.9 | -0.4 | 112.2 | 116.5 | 1,845 |
| Darius GarlandG · 26 | +1.2 | -1.6 | -0.4 | 116.7 | 113.8 | 4,787 |
| Jordan MillerG · 26 | -0.1 | -1.5 | -1.6 | 112.8 | 115.0 | 2,233 |
| Blake WesleyG · 23 | -1.1 | -0.6 | -1.7 | 108.6 | 112.4 | 1,137 |
| Bradley BealG · 33 | -1.1 | -1.8 | -2.9 | 110.7 | 119.0 | 1,570 |
Points per 100 possessions a player adds on offense and saves on defense, separated from the teammates and opponents he shared the court with (last three seasons, recent ones weighted more). Positive = better on both. On-court ratings are the team's points scored/allowed per 100 possessions while he plays. Players with fewer than 500 possessions aren't rated.
Value for money
Best value
- Jalen Pickett · $2.4M · net +0.8 (+3.1 per $10M)
- Kobe Sanders · $2.6M · net +0.8 (+3.1 per $10M)
- Kris Dunn · $5.7M · net +1.3 (+2.3 per $10M)
Least impact for the money ($10M+)
- Darius Garland · $42.2M · net -0.4
- Brandon Ingram · $40.0M · net -0.3
- Rui Hachimura · $14.0M · net -0.1
Net impact from the lineup model vs this season's salary. Above the dashed line = makes the team better. Players with fewer than 1000 possessions over three seasons aren't shown.
Contracts
Payroll $188.9M · 25th highest in NBA · incl. $8.0M for players no longer on the team
1 player has changed team since the salary export (trade or waiver), so this payroll may be out of date until the next download.
| Player | Salary | Share of payroll | Years left |
|---|---|---|---|
| Darius GarlandG · 26 | $42.2M | 22% | 2 |
| Brandon IngramF · 29 | $40.0M | 21% | 2 |
| Max StrusG · 30 | $16.7M | 9% | 1 |
| Rui HachimuraF · 28 | $14.0M | 7% | 2 |
| Derrick Jones Jr.F · 29 | $10.5M | 6% | 1 |
| Keaton WaglerG · 19 | $9.7M | 5% | 4 |
| Brook LopezC · 38 | $9.2M | 5% | 1 |
| Gradey DickG · 22 | $7.1M | 4% | 1 |
| Isaiah JacksonF · 24 | $7.0M | 4% | 2 |
| Bradley BealG · 33 | $6.4M | 3% | 4 |
| Kris DunnG · 32 | $5.7M | 3% | 1 |
| Jordan MillerG · 26 | $5.3M | 3% | 3 |
| Yanic Konan NiederhauserC · 23 | $2.9M | 2% | 3 |
| Kobe SandersG · 24 | $2.6M | 1% | 4 |
| Jalen PickettG · 27 | $2.4M | 1% | 1 |
| Cam ChristieG · 21 | $2.3M | 1% | 1 |
| Baba MillerF · 22 | $1.7M | 1% | 4 |
| Nick MartinelliF · 22 | – | 0% | – |
| Blake WesleyG · 23 | – | 0% | – |
| Nicolas Batumwaived, still paid | $5.9M | 3% | – |
| Johni Broomenow with MIN (waived or traded): check the next salary export | $2.2M | 1% | – |
Salaries, contract years and payroll from the Basketball-Reference contract tables, exported 04 Nov 2026. Players without a contract there (mostly two-way deals, which don't count toward payroll) show ESPN's figure when it has one. Players waived but still paid are listed at the bottom.